Dashboards
Introduction
A dashboard is a collection of selected reports used to provide a single of pane of glass visibility across processes you manage. There can be more than one dashboard created and its visibility can be restricted to different roles and groups as required.
Examples of dashboards include:
- CIO - showing performance of the ITSM processes
- Service Desk - showing Incident/Request based statistics
- Agent - showing statistics of tickets assigned to them and their groups
- Asset Management - showing statistics of hardware and software assets
Create a Dashboard
To create a new dashboard:
At the top menu bar of your Servicely environment’s webpage, you’ll find a “Dashboard” dropdown menu to the left of your logged on user’s first name. Left click and expand the dropdown menu and you will see a “Create dashboard…” menu item. *(**(New in 1.8) *In situations where you want to limit who can see the “Create dashboard” option in the dashboard dropdown, you can add/modify the application “dashboard.create.role_required” to only let people with a specific role see it (such as: “administrator” or “itsm_agent” in the value)).
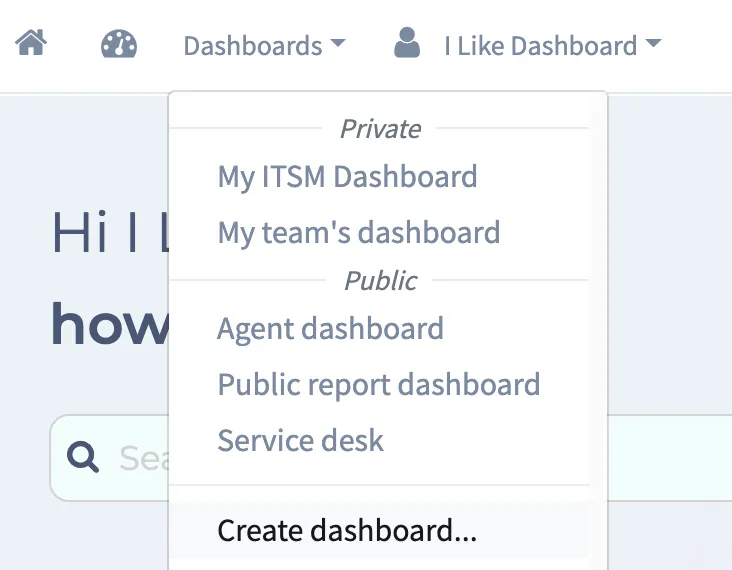
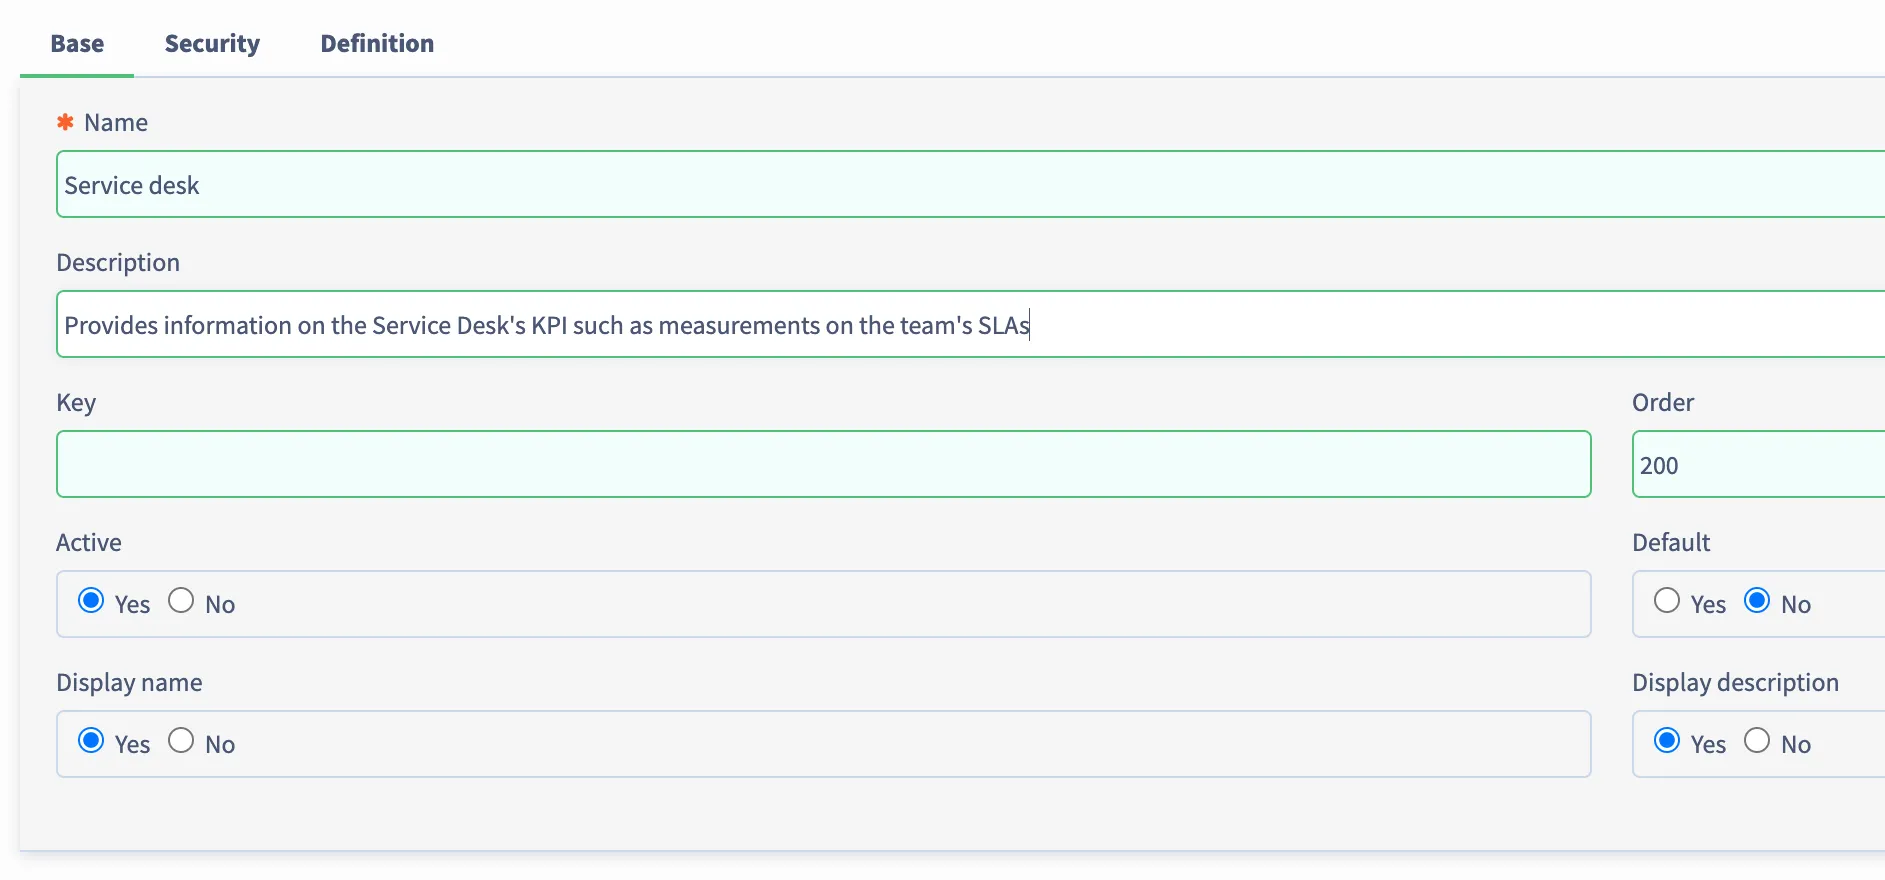
2. Left click on the “Create dashboard…” menu item and you will be taken to a “Report dashboard” definition screen where you can set some of the fields:
| |
|---|---|
Name | Name of the Dashboard |
Description | Description of the Dashboard |
Active | If set to Yes, the Dashboard will be available |
Order | The order in which the Dashboard is displayed in the dropdown selection of dashboard names |
Display name | If set to Yes, the Dashboard’s Name will be displayed |
Display description | If set to Yes, the Dashboard’s Description will be displayed |
Visibility restrictions
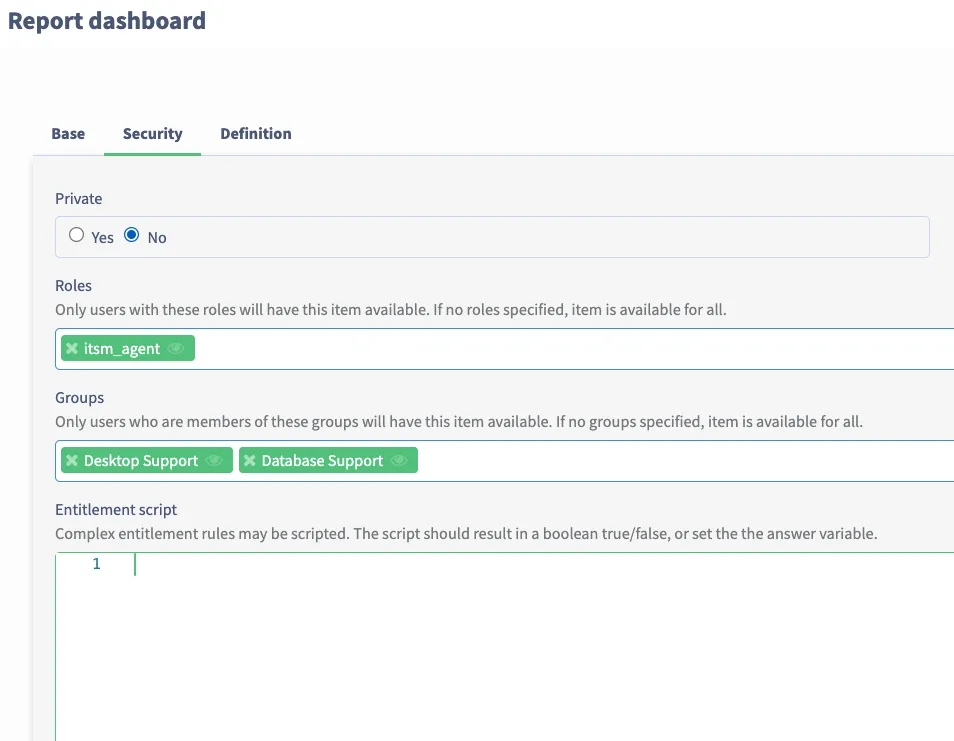
A dashboard’s visibility can be restricted by a combination of:
| |
|---|---|
Private | Private = “No” means the dashboard is visible to other users assuming the other criteria below are met. |
Roles | Servicely system roles that logged on user must have before they are allowed to view the dashboard. |
Groups | Servicely groups that logged on user must be part of before they are allowed to view the dashboard. |
Entitlement script | Allows for more complex restrictions on who can view the dashboard. |
Below is a Servicely screenshot of the dashboard configuration page where you can update the dashboard’s security/visibility restrictions.
Update a Dashboard’s layout and content
Once a Dashboard is created, you can then start setting up its layout and add reports onto it.
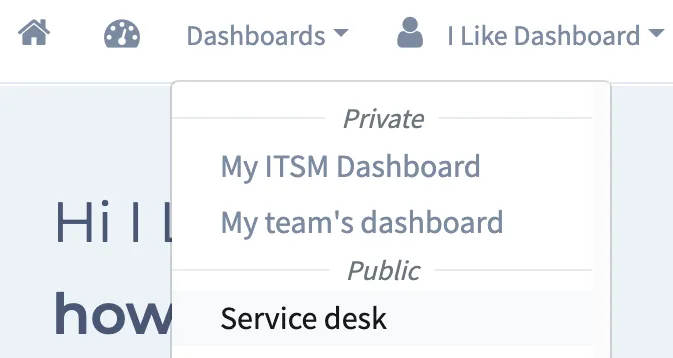
To do this, view the Dashboard, e.g. from the Dashboard’s dropdown menu at the top of your screen and left click on the Dashboard that you want to view:
On the bottom left of the Dashboard’s view screen, you’ll see “Edit” button if you have permission to edit it:
On the resulting screen, you may start adding a “Layout” or a “Report” element by left clicking on your selection and then dragging and dropping it onto the desired location on the Dashboard. Please refer to the “User interface elements” section for more details about “Layout” and “Report”. After every drag and drop, you will need to configure it such as for Tabs, how many tabs and what are the labels, and for Reports, what Report to show.
When you have completed your changes, you can click the “Save” button to save your changes.
To update an existing element on your dashboard:
- Go to the Edit view of your Dashboard, refer to the start of this section
- Hover over your mouse pointer above the element you would like to update
What you can do:
| |
|---|---|
Edit (wheel icon) | Update the parameter of the element. E.g. for a Report, change the Report to display. |
Move (directional icon) | Move your element somewhere else on the dashboard. Note that you can also left click anywhere on the element and drag it to another part of the Dashboard. |
Edit JSON (wrench icon) | You can edit the underlying JSON object that makes up the element. You will need a level of knowledge of JSON. |
Copy (copy icon) | Create a duplicate of the selected element that you can drop below other existing elements. Note that after you clicked on the Copy icon, as you hover over your mouse pointer above other elements, you’ll see the following icon: |
Remove (cross icon) | You can remove the element off the Dashboard |
User interface (UI) elements (Layout and Report)
There are various UI elements that are supported on the Servicely dashboard. The following sample report shows a combination of some of them:
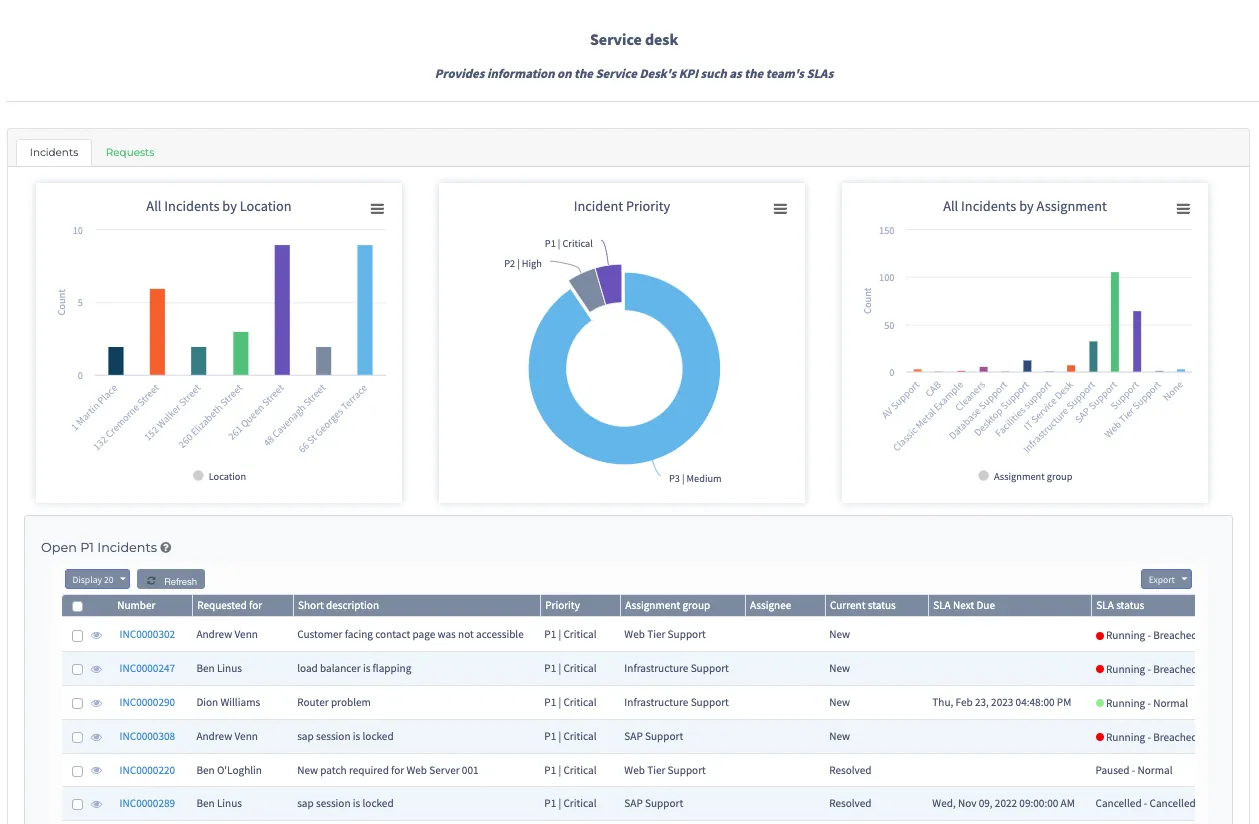
Layout elements:
| |
|---|---|
Columns | Spreads dashboard real estate evenly across the screen. For example shows three different reports in a row. |
Panel | Wraps a report in a HTML block that you can apply custom title and styling onto it.To apply a title, edit its JSON structure to include a top level attribute called “title”, example below where title is set to be “Overview”:The Panel’s title then is displayed like: |
Tabs | Split a dashboard into multiple tabs/pages to group information on a single dashboard. |
Well | Wraps a report in a HTML block that you can apply custom styling onto. |
Report elements:
| |
|---|---|
Public Reports | Reports that have been marked as not Private. These reports are available to anyone that has met the Security criteria applied to them. For more information please refer to ReportsReports |
My Reports | Private reports that logged on user had created. |
Filtered list | Shows a list of records based on the supplied table and filter. |
Update a Dashboard’s Definition
To update a dashboard’s Name, Description or the Visibility restrictions, go to the Dashboards menu links:
| |
|---|---|
Reporting > Reports > My report dashboards | Shows a list of private reports created by the logged on user |
Reporting > Reports > All public report dashboards | Shows a list of public reports |
You will then need to select the Dashboard you want to update and you can update the relevant fields same way as creating a new Dashboard.
Administrative roles
The following are the different system roles applicable to Dashboards:
Role | Description |
|---|---|
administrator | Can create dashboardsCan view and edit all public and private dashboards’s layout and content.Can read/edit entitlement script on dashboards. |
report_editor | Can create dashboardsCan view and edit the layout and content of all public dashboards and also the private ones that they had created.Can make their own private dashboards to be public. |
platform_agent | Can create dashboardsCan view and edit the layout and content of all public dashboards and also the private ones that they had created. |